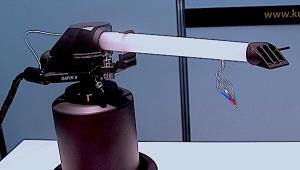
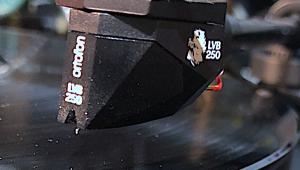
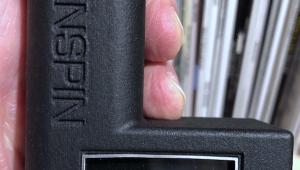
"shaknspin" Electronically Measures Turntable Speed Plus a Great Deal More
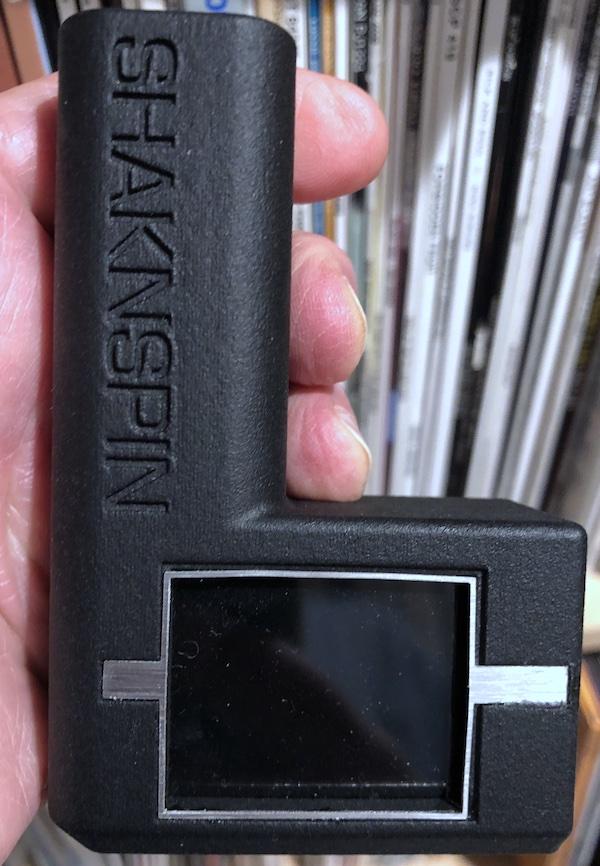
The "L" shaped battery powered device featuring a small florescent display was designed in Portugal by Sempersonus and for now is available only directly through them via their website. Depending upon the exchange rate, "shaknspin" costs around $300. Here's how it works:
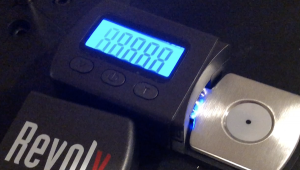
Upon power up by pushing a small button on the unit's underside you're asked to "stay still", which is critically important because during this time the unit "self calibrates" and if you move or shake it, you will end up with incorrect results.

Once the screen lights up, put the unit gently down on a flat surface until the menu appears:
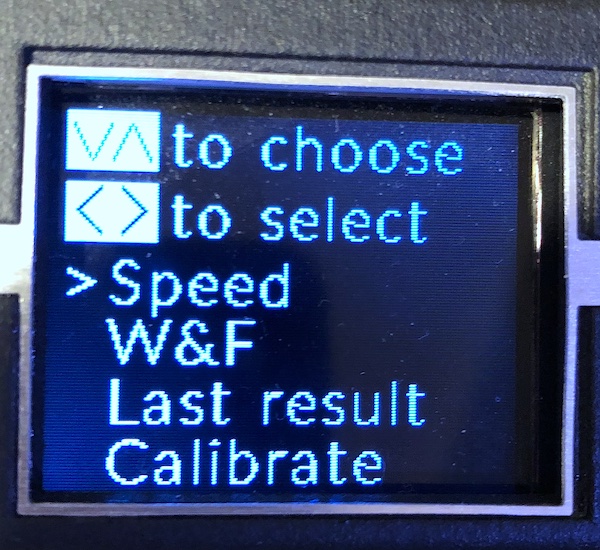
Navigating the menu will take a bit of learning and hand coordination. "Pitching" the device vertically lets you select the menu option ("speed", "W&F", "Last result" and "Calibrate"). Once the arrow moved to the desired selection you "roll" the device laterally to begin the selected option. Obviously you start with "Speed". Upon selecting it, place the shaknspin on the spinning platter with the corner pushed against the spindle. There's a hole under the device that allows you to place it directly on the spindle but the inventor says the corner placement is equally accurate and actually more so in most situations, especially where the spindle height prevents the unit from laying flat on the platter. The device will show in large numbers good to two decimal points, the platter's speed. If that's all you're interested in, you're done. But no one reading this will want to stop there.
Reverting to the menu page select "W&F" and again carefully place the unit adjacent to the spindle and it will begin measuring after which it flashes to let you know it's completed the task. It then reads "calculating" followed by this screen:
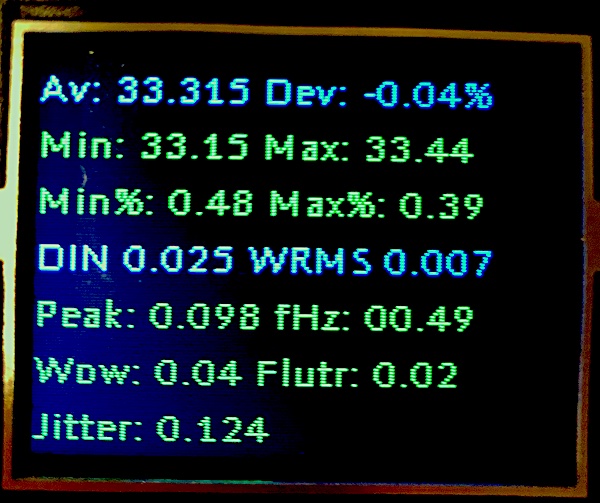
Here you see the average measured speed, the percent deviation of the average, the minimum and maximum actual speed and then min and max as percent deviations from the average speed. Below that is the W&F expressed as DIN peak to peak (2 sigma) weighted by the IEC/DIN 60386 curve, RMS of the observed wow and flutter. Also, W&F peak-to-peak. The Hz measurement if different from zero represents the periodicity of the low frequency (wow) strongest modulation (most relevant). Zero means too insignificant in amplitude or irregular in period to be considered. Below that is the same Peak2S wow measurement but weighted by a bandpass filter centered on 2Hz. and the same Peak2S flutter measurement weighted by a bandpass filter centered on 50Hz. and finally jitter (average speed change/second). I realize some of these terms (DIN, weighted, unweighted) may be unfamiliar to some but rather than stop here to explain, let's move on to the other measurements and all of these terms can be explained in another post.
According to the instructions a few additional values are calculated but only displayed through the smartphone app link in the instructions. I won't list those measurements here. Unfortunately for now it's a Android only app so I couldn't try it. The iOS version should be coming shortly (they all say).
Next, by rolling the unit up or down you can scroll through various graphical views of what's just been measured. The first allows you to observe the full length of the measured session in 0.5s segments. Here's one:
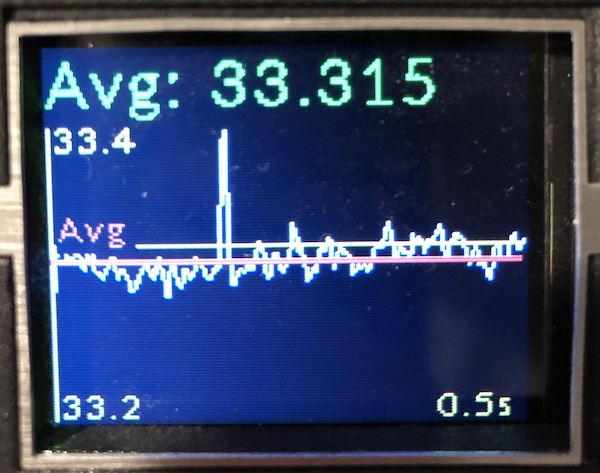
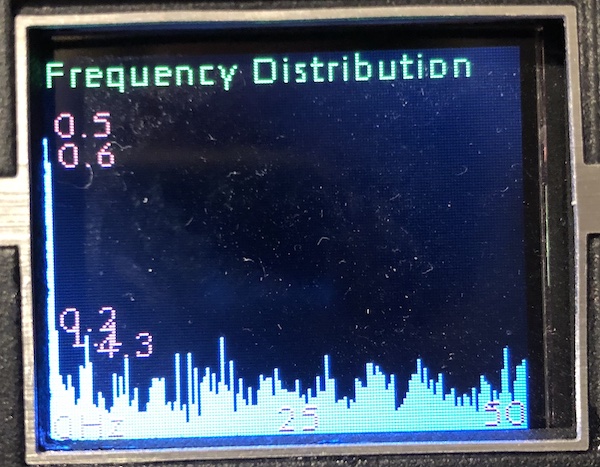
By rolling right you go to the next 5 second segment, etc. or back to get to the previous one. The high-pass view is also available but we'll skip that to get to the frequency distribution graphic post FFT analysis. It displays the strongest modulating frequencies found in the 0-50Hz spectrum. The highest five lower than 10Hz are labeled:
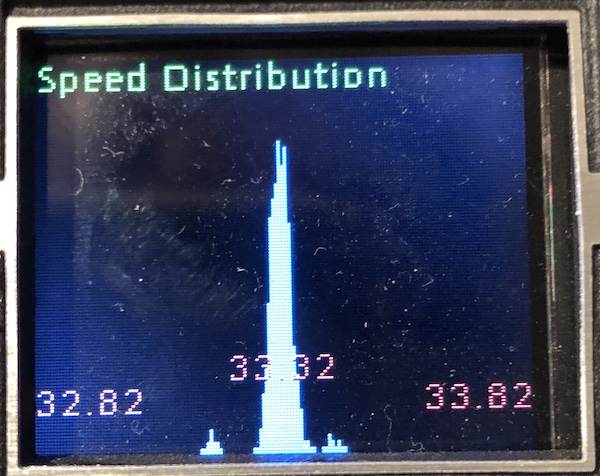
One more roll down and you access the final view, which is the speed distribution. This is a histogram of the measured speeds centered on the average. The narrower the curve the better.
Rolling down one more time brings you to the Bluetooth export option where you can automatically transfer the data to the smartphone app, which can generate a CSV file easily read into an Excel spreadsheet. Obviously that wasn't able to be tried at this time. One cool thing: all of the data can be sent to the company, which is building a turntable performance database.
One final thing: the unit has a "calibrate" mode you can access to adjust the device should it appear to be "off". Before doing so, repeat the original start up calibration to be sure you weren't moving around. If you do choose to calibrate the device, be sure to use a known 100% speed accurate turntable set using the best available strobe unit you have.
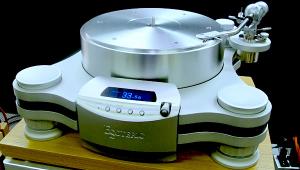
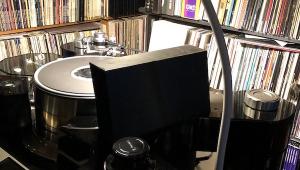
In the "old days" it used to be said turntable test results can be only as good as the test records being used to produce them. With the shaknspin, the results can be only as good as the programming that went into its creation. For now, there's no way to knowing how good that is other than to say that I tried the shaknspin on 3 of the world's finest turntables that happen to be here right now: two direct drive and one belt and the speed calculation at least appeared to be "right on" for all three. Which turntable produced these results? Not saying! I will say though, for my work shaknspin (pending accuracy verification) will become an indispensable tool of the trade. For you? Depending upon the cost of your turntable, I don't see how anyone can be without it, if just to bring to a show off friend's listening room and maybe pull down his electronic pants. Did I just write that?


| Equipment Reviews | The Gruvy Awards | Blogs Analog Tips | Columns Music | Show Reports | News Resources |
 © 2025 AnalogPlanet
AVTech Media Americas Inc.
All rights reserved